


EMS and Fire Report Builder for Ad-Hoc and Custom Metrics
Unified Reporting Solution
Forget the hassle of accessing multiple software systems to compile reports into one spreadsheet for further analysis. With AngelTrack, you can instantly access all your reports in one centralized location, updated in real-time.
Each subsystem within AngelTrack comes with its own unique set of reports and data visualization tools, ensuring you have all the necessary instruments even if you're utilizing just a part of it or in the midst of a transition.
AngelTrack’s comprehensive systems (CAD, ePCR, Billing, Supervision, Fleet Management, Fire RMS, etc.) all contribute to a centralized data hub, offering a consolidated source of truth to simplify all your operation's reporting. Think about the hours your agency spends daily creating, reviewing, finalizing, and disseminating reports. Now envision the ability to dispatch a custom report, populated with live data as soon as you initiate it, all with a single click.
Systemwide Smart Data Validation
Data quality is a universal challenge. Regardless of the complexity or simplicity of your report, its value hinges on the accuracy and careful curation of the underlying data.
To tackle this issue, AngelTrack employs a smart verification system on every data entry page and across all systems. This smart verification ensures the precision of entered data and helps to prevent errors such as typos, logical inconsistencies, or unsuitable data types. Each page features an intelligent back-end that verifies the input data, along with a record-locking mechanism to avert accidental overwrites when multiple users modify the same record.
Preconfigured Dashboards for Summarized Operation-wide Insights
Each system in AngelTrack comes equipped with a dashboard designed to provide a comprehensive overview of the respective department. These dashboards furnish curated, real-time data aimed at helping you identify, troubleshoot, and rectify workflow issues as they emerge.
Developed in collaboration with industry professionals, these dashboards have been conceived and designed by individuals who understand your position and the challenges you face. They are instrumental in pre-empting issues before they escalate, thereby simplifying your everyday administrative tasks.
CotS Comprehensive GADCS reporting
Medicare recently announced the Ground Ambulance Data Collection Survey which comprises a massive amount of data that every ground transport ambulance provider must respond to or face a drastic reduction in reimbursements.
We've developed a report that canvasses all the data stored within AngelTrack, aligns it with Medicare's GADCS requirements, and consolidates it into a single page. This tool has been specifically designed to aid you in completing the required instrument swiftly and efficiently.
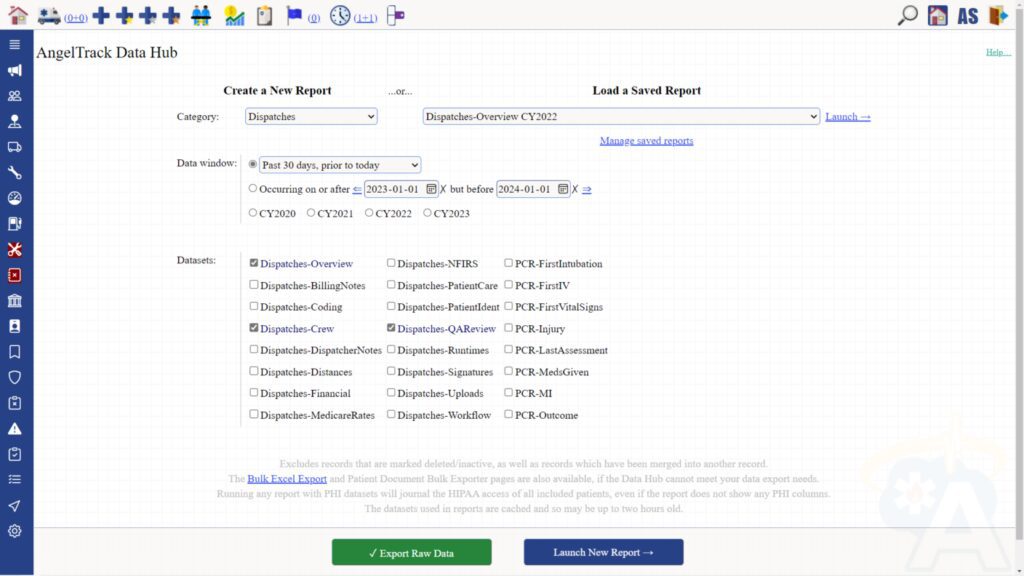
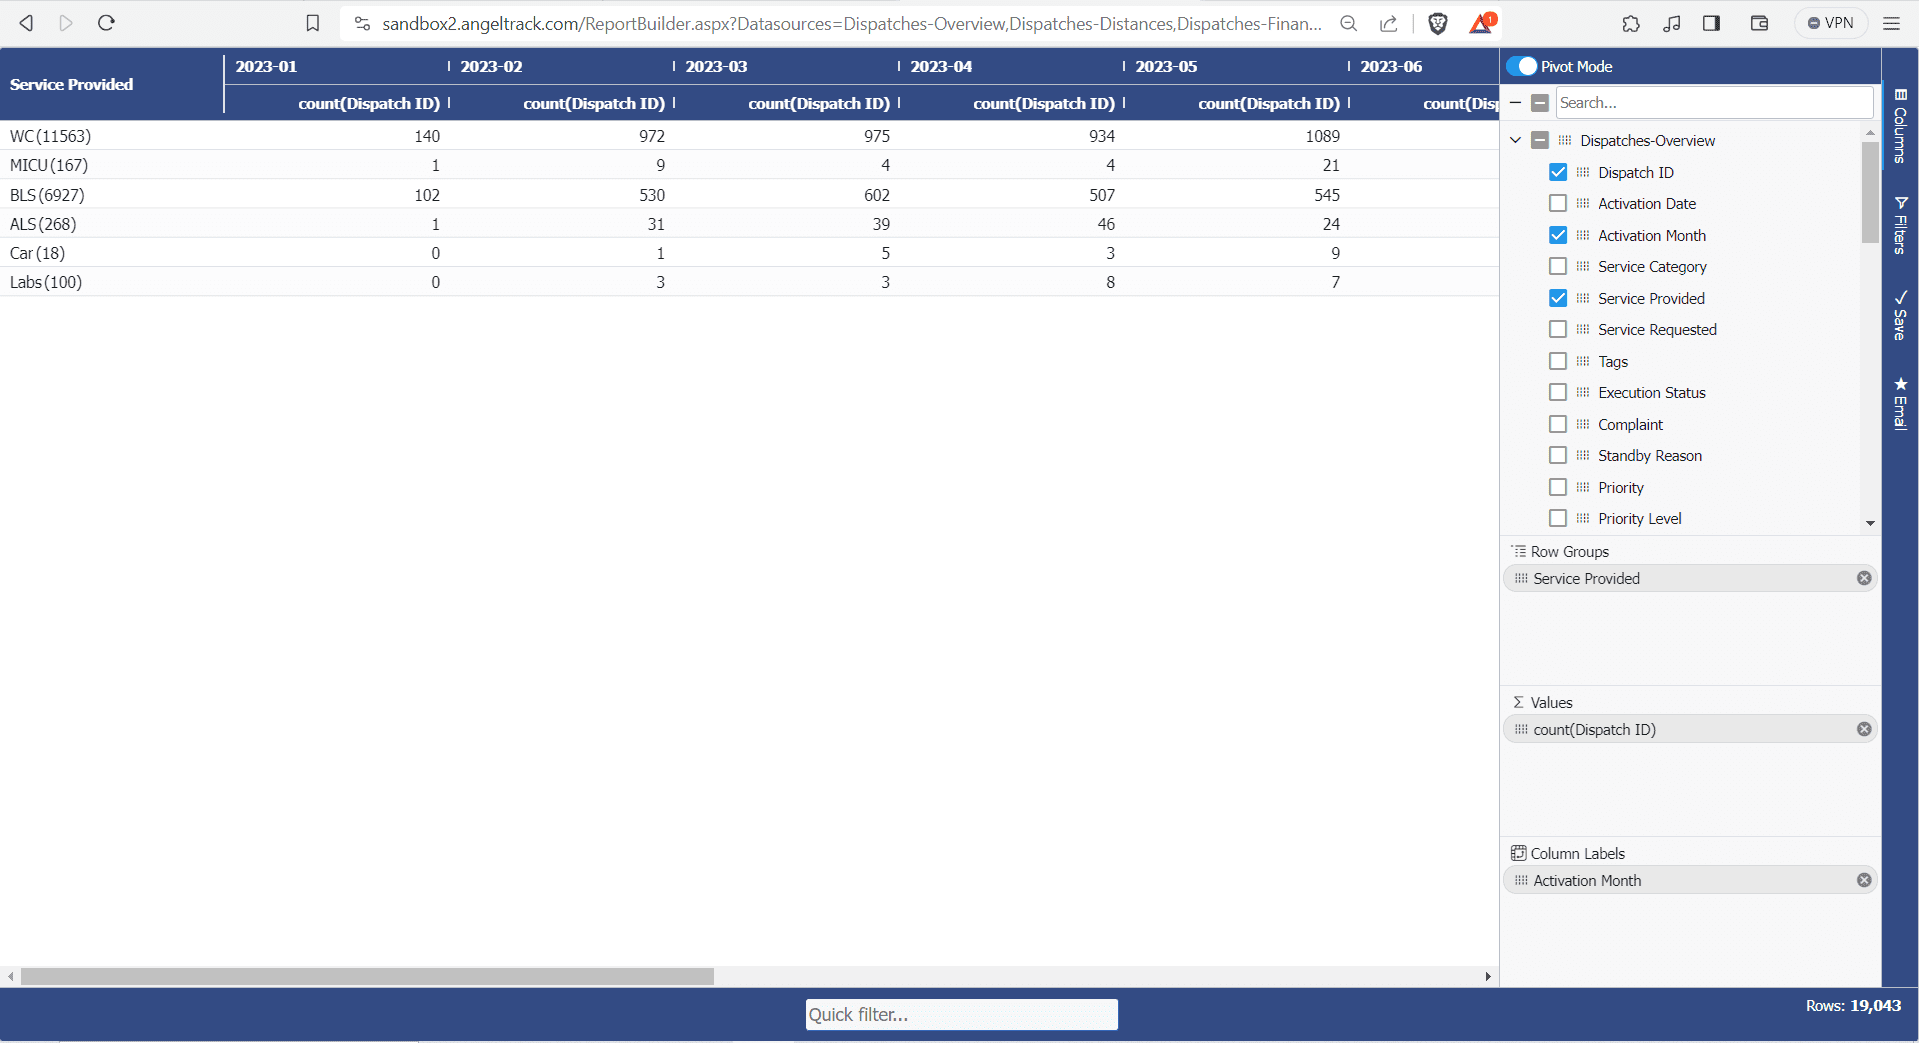
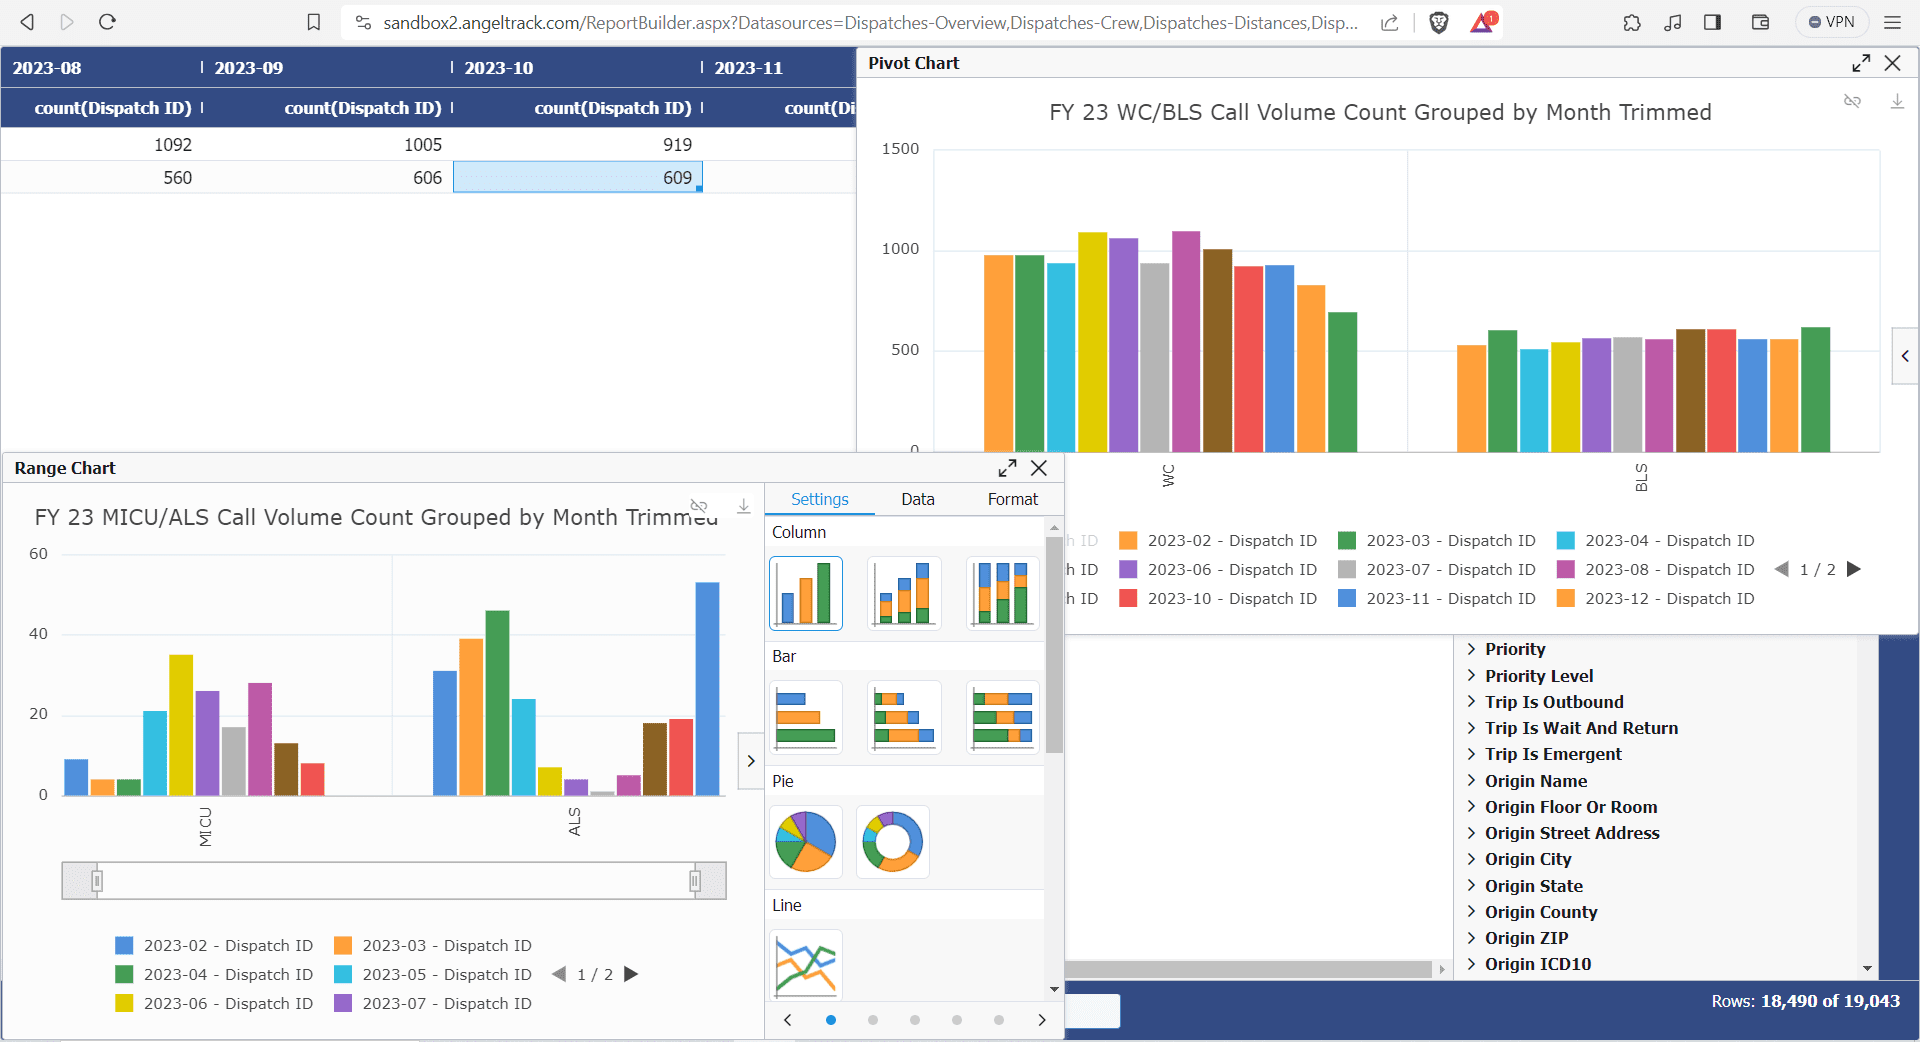
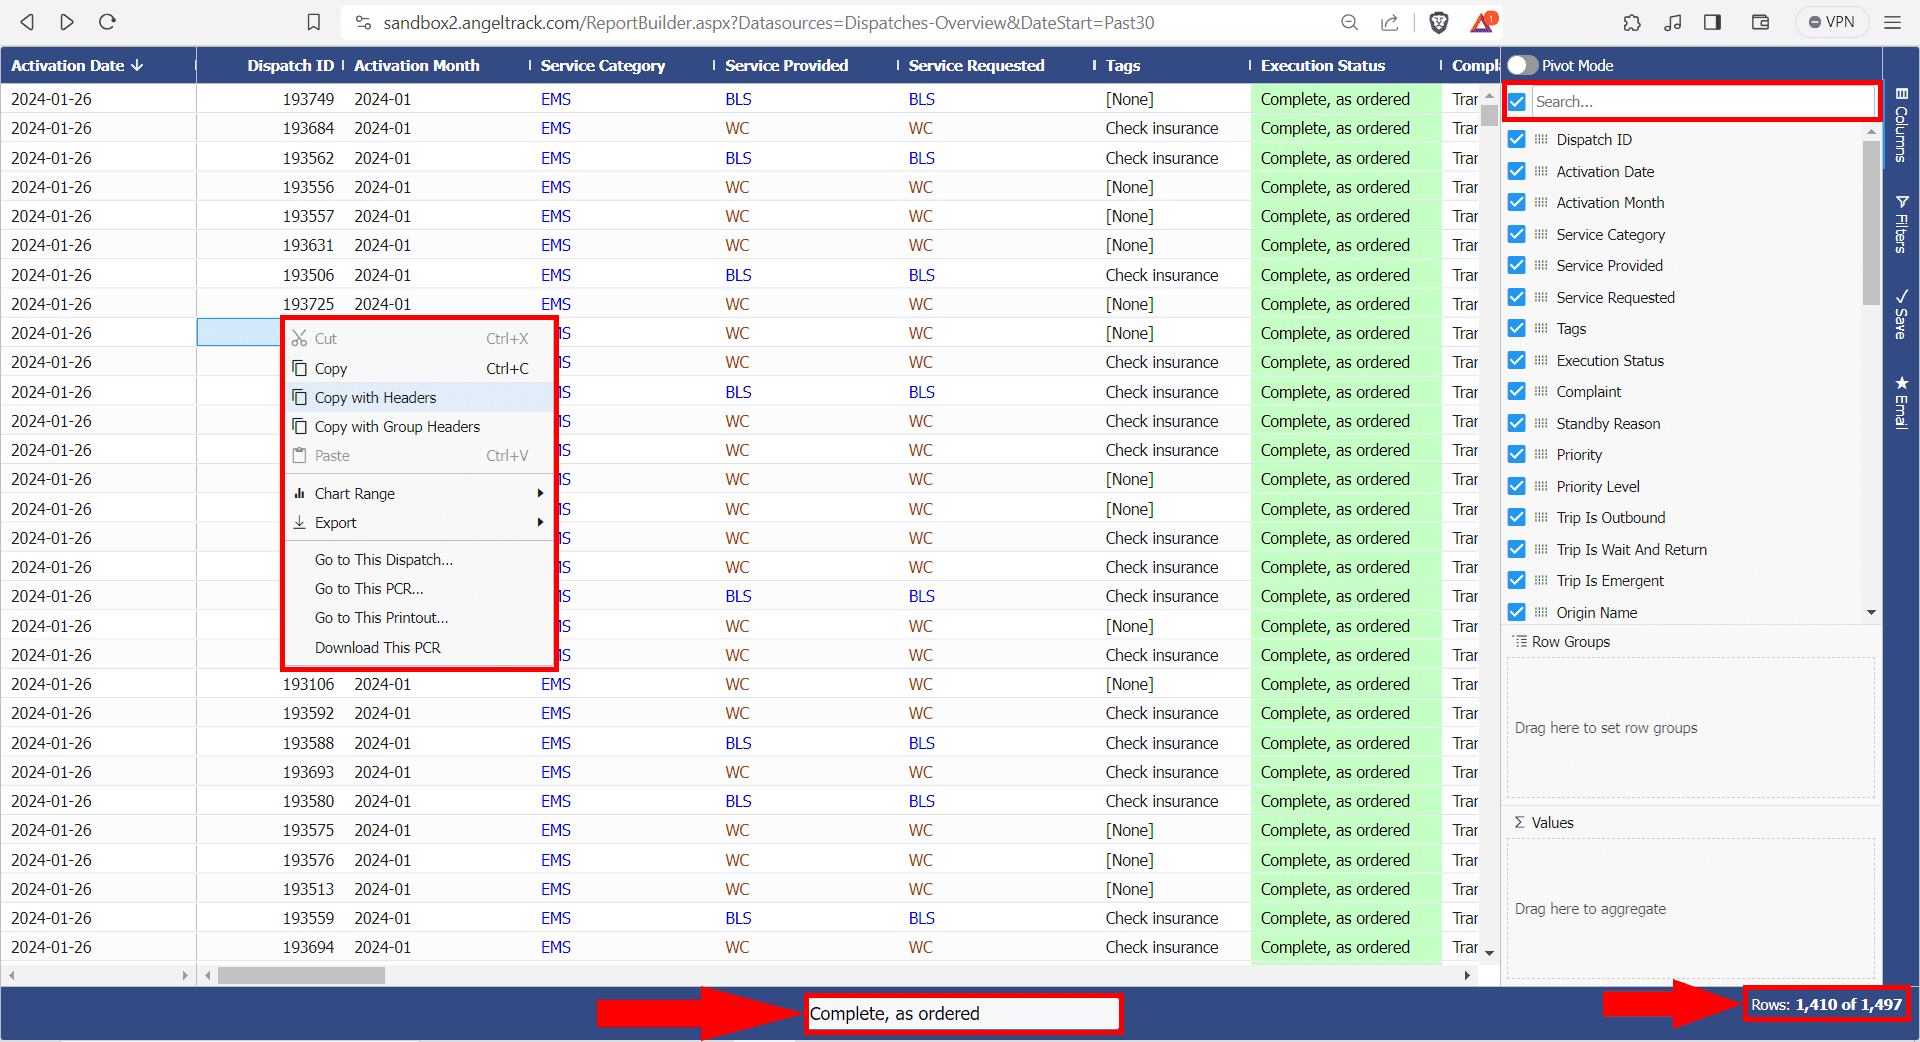
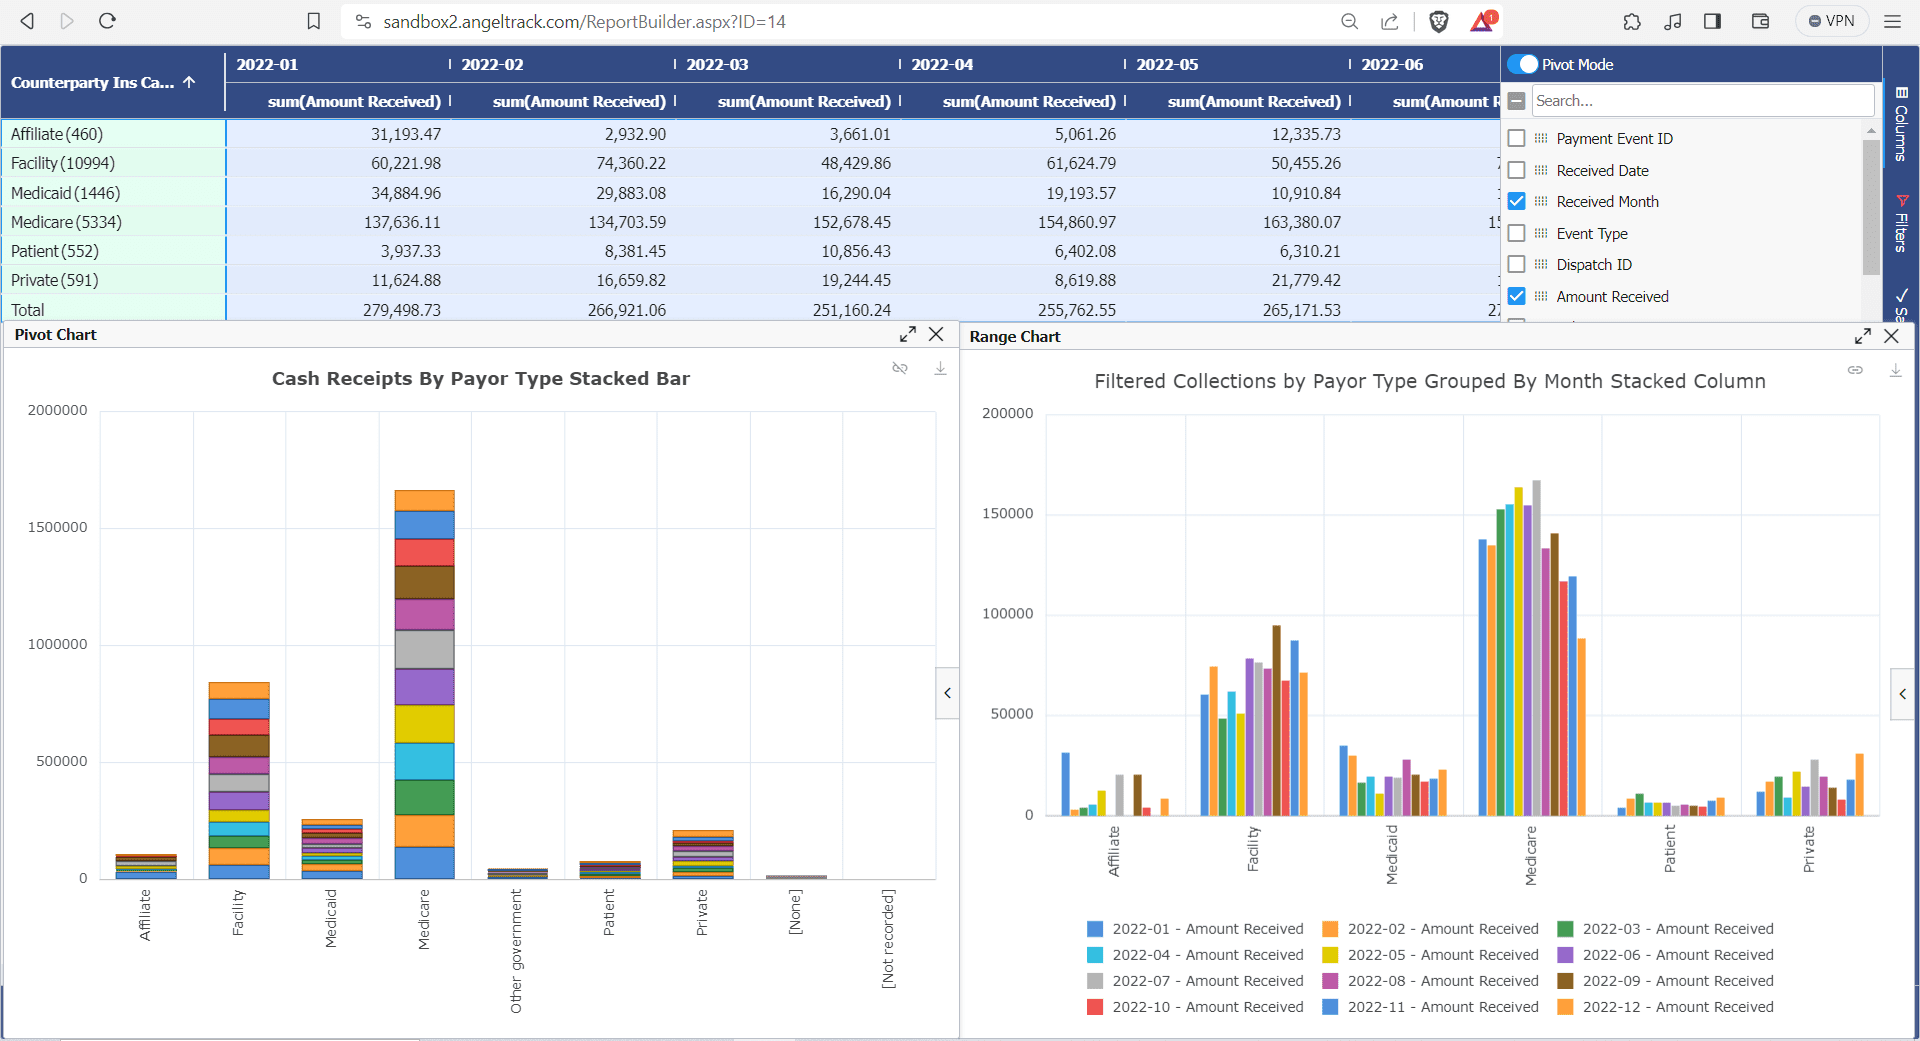
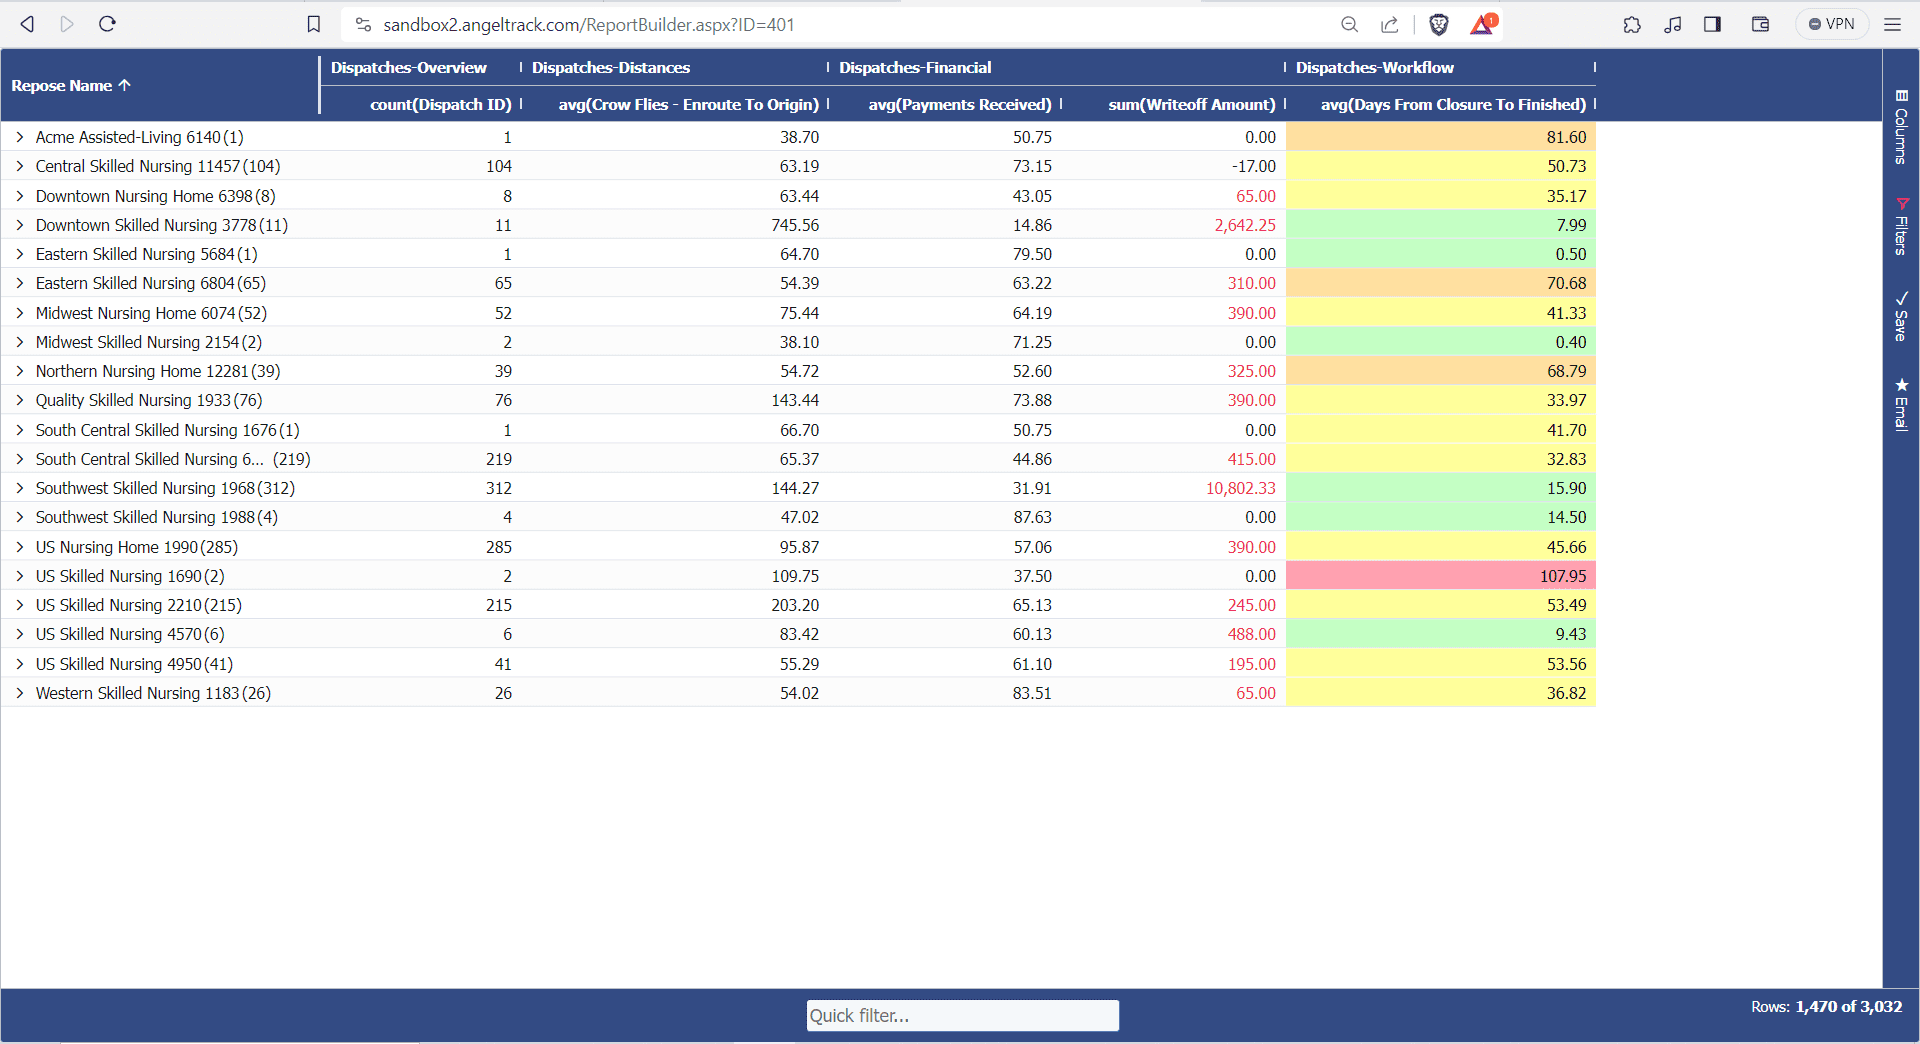
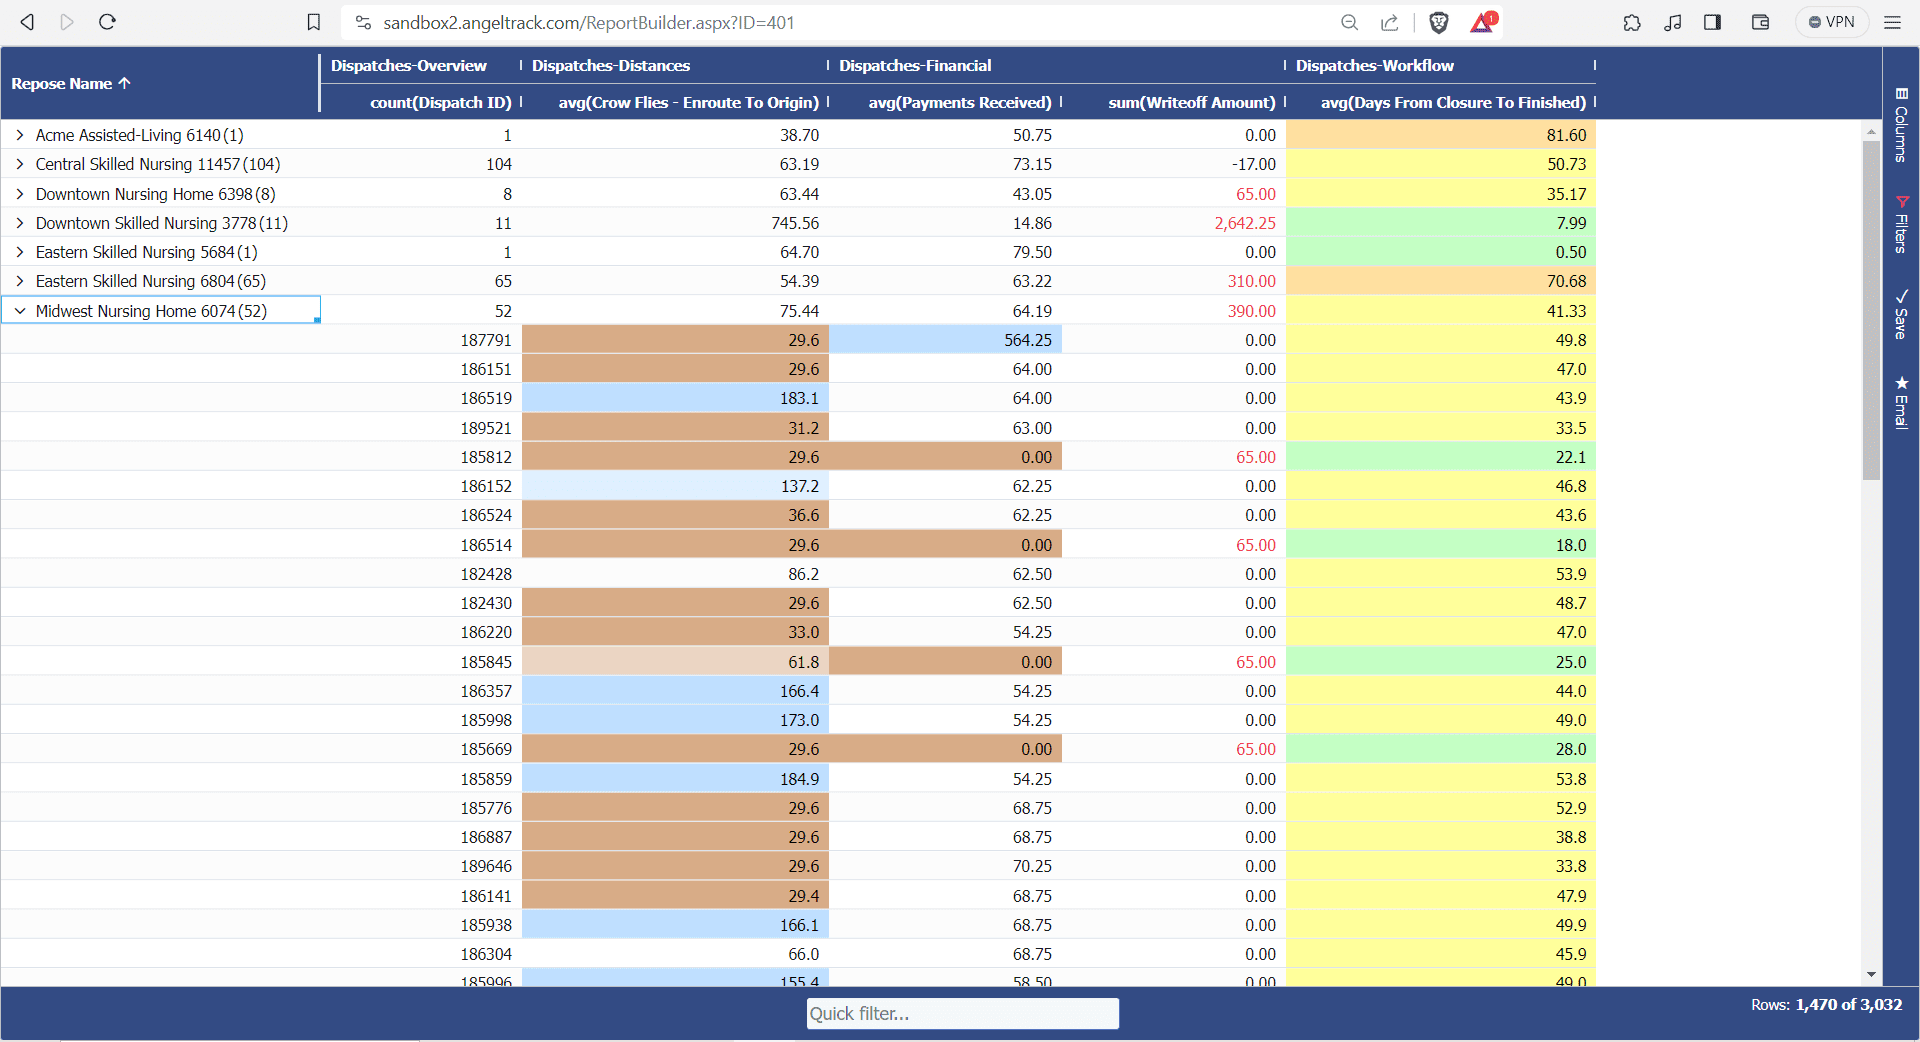
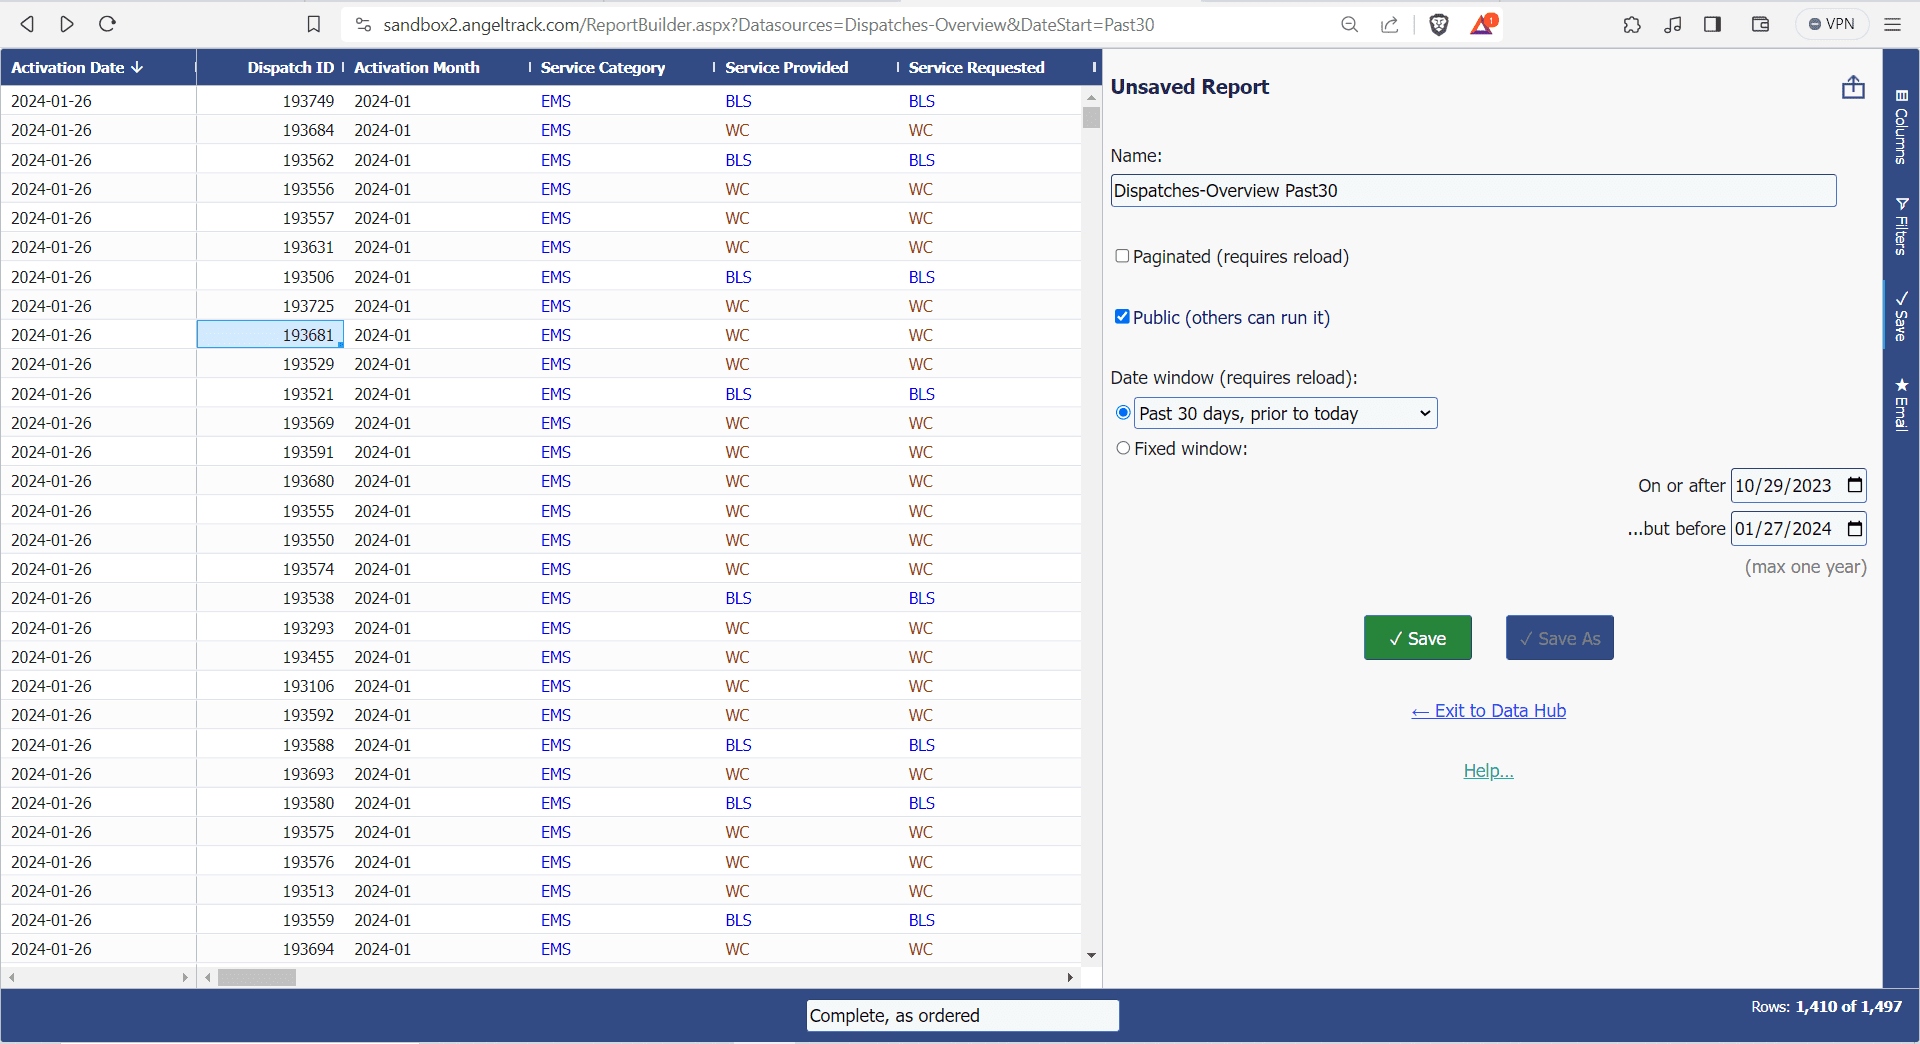
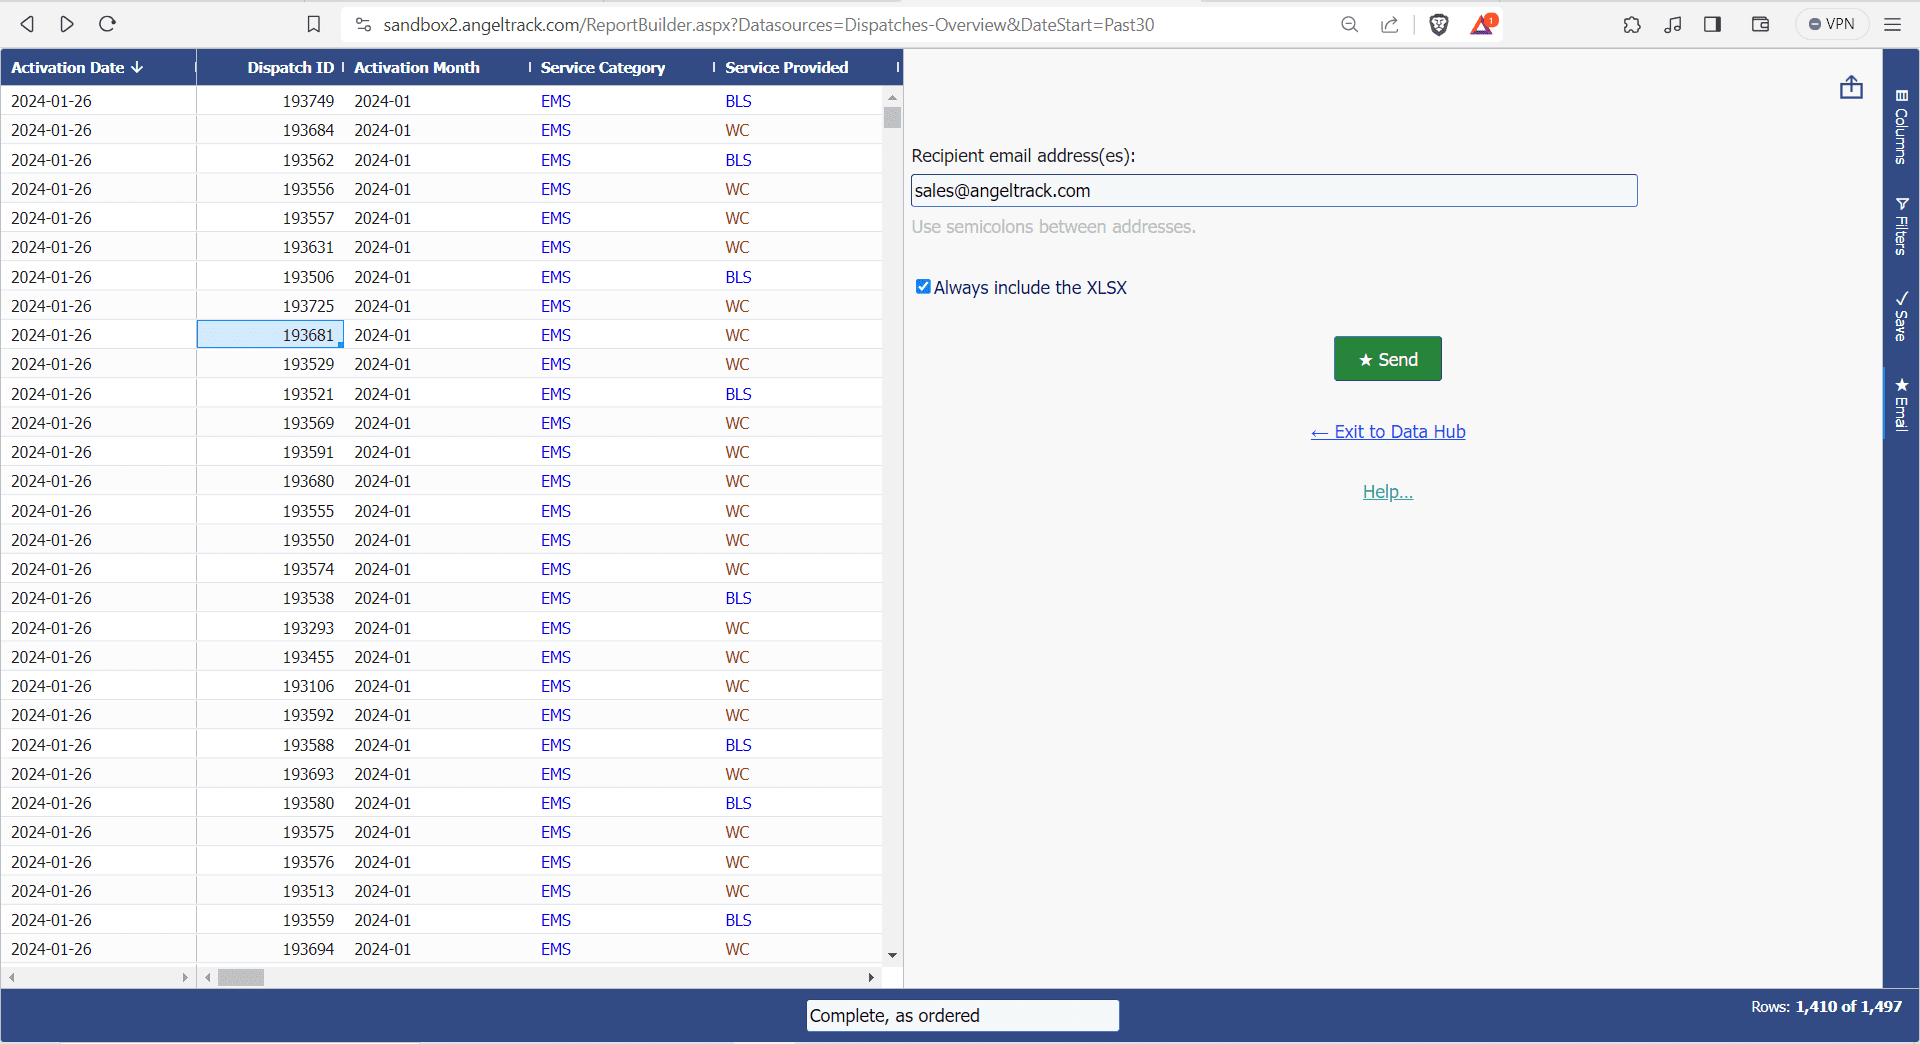
Report Builder
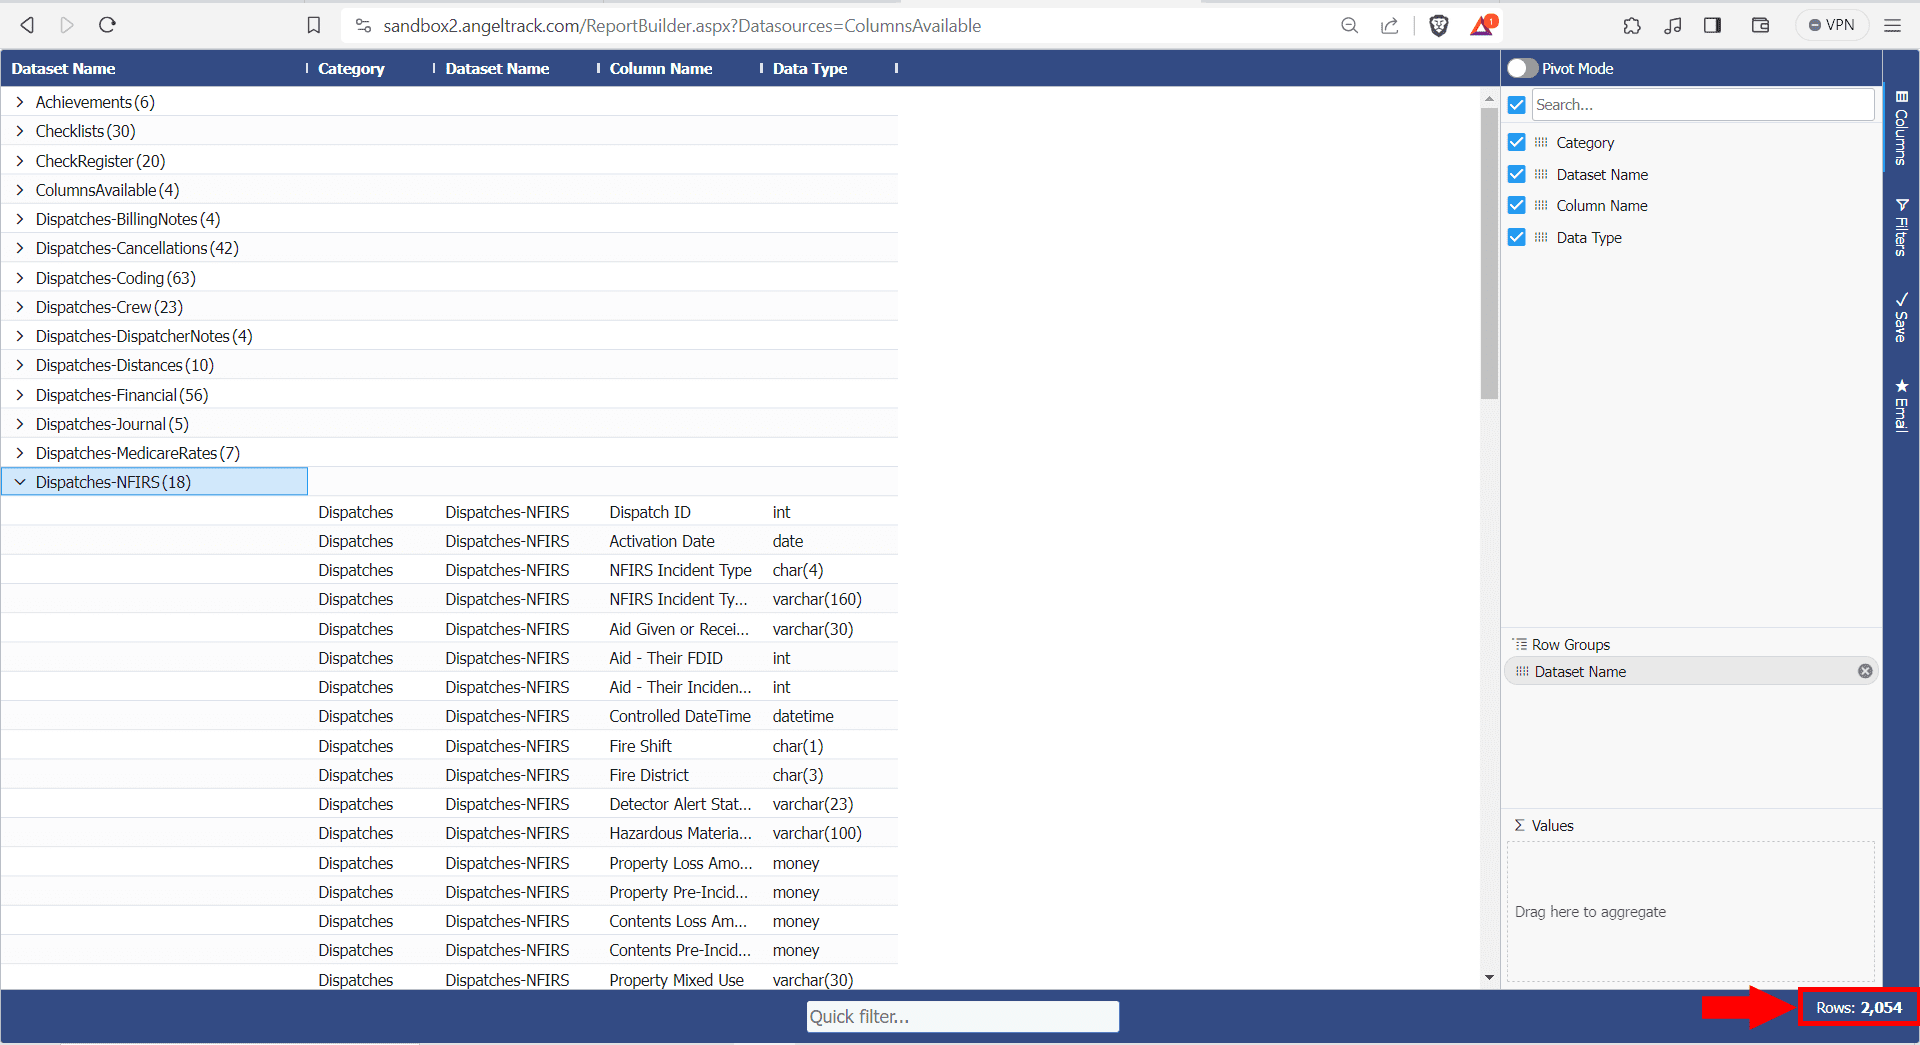
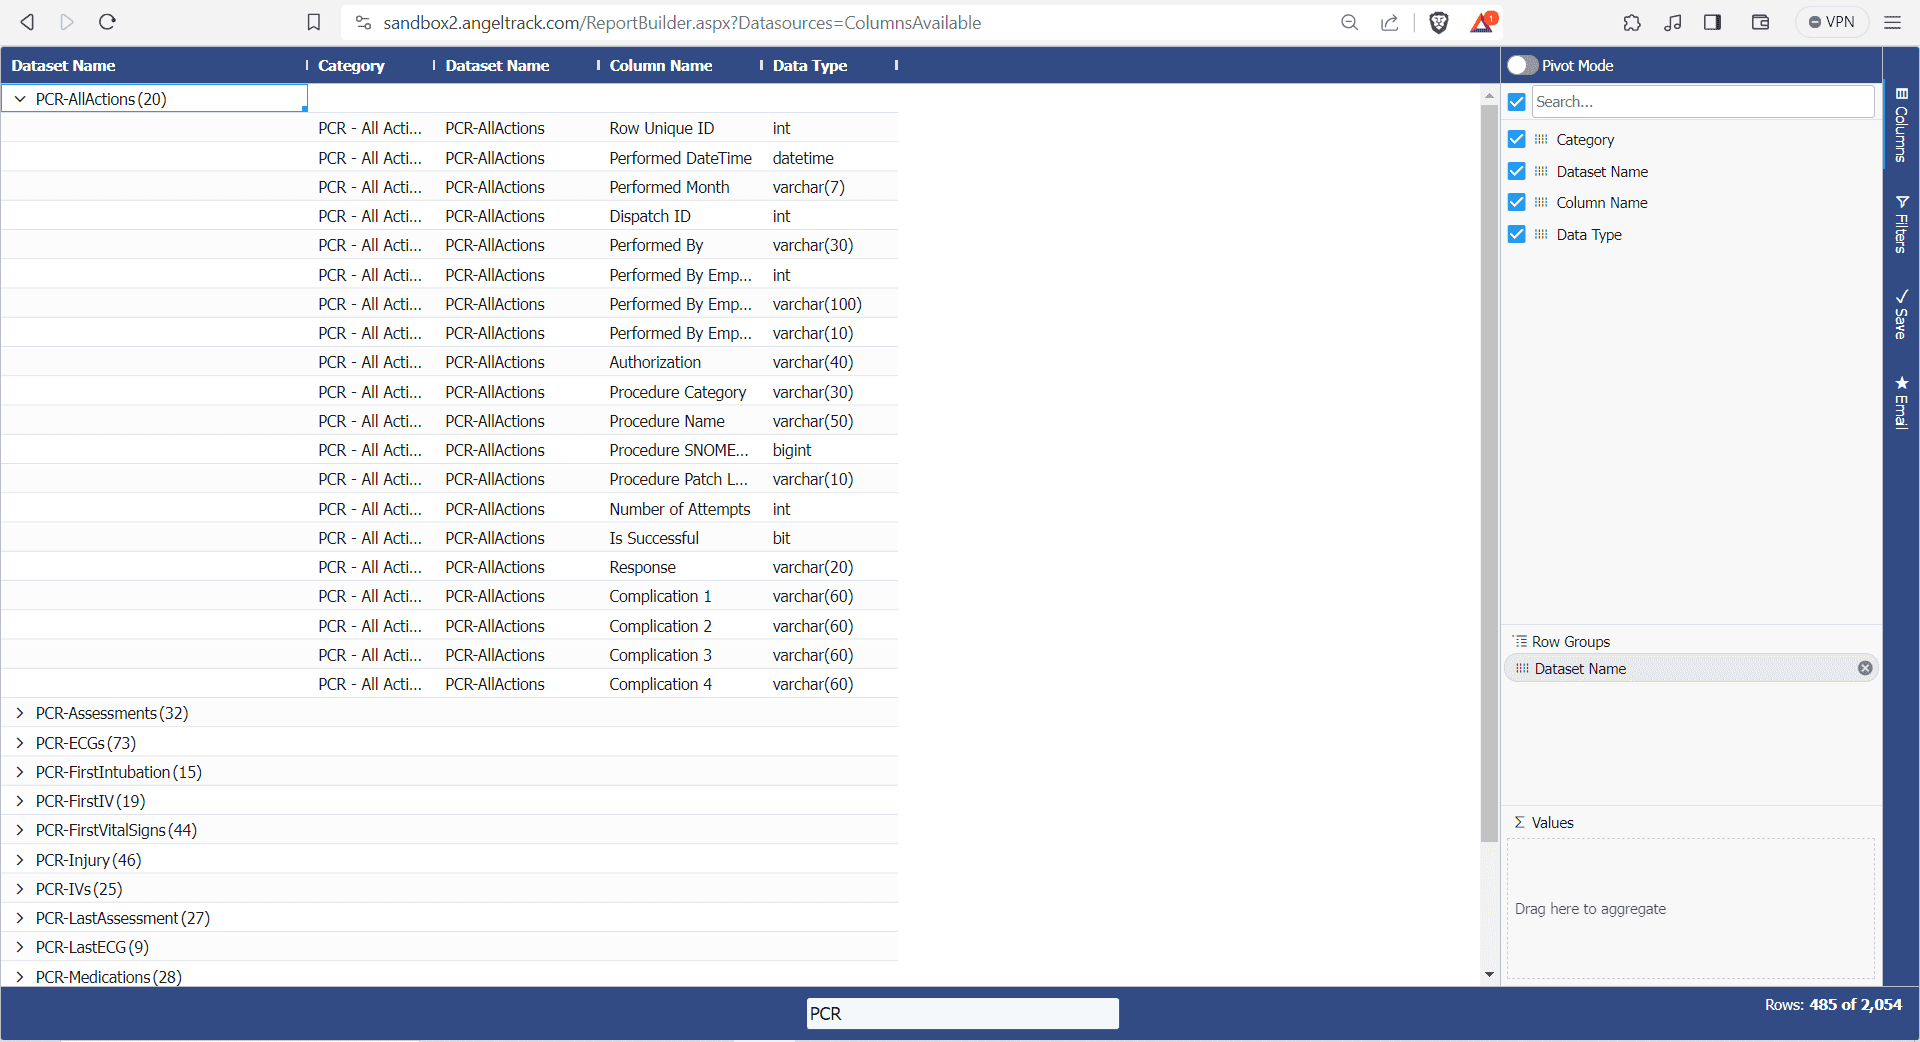
 AngelTrack is always careful with backwards-compatibility, so you don't have to worry about your saved reports breaking as we continue to improve the product and release new data sets.

Want to see it in action?
Schedule a free demo to learn how AngelTrack can radically optimize your EMS & Fire operations. There's no strings attached, no daunting paperwork, and absolutely no charge. It's your chance to explore AngelTrack at your own pace.